
Real probability scales for matplotlib
| CI | Badge |
|---|---|
| Tests |  |
| Formatting and Types |  |
| Linting |  |
| Docs |  |
Official releases are available through the conda-forge channel or pip
conda install mpl-probscale --channel=conda-forge
pip install probscale
This is a pure-python package, so building from source is easy on all platforms:
git clone git@github.com:matplotlib/mpl-probscale.git
cd mpl-probscale
pip install -e .Simply importing probscale lets you use probability scales in your matplotlib figures:
from matplotlib import pyplot
from scipy import stats
import probscale  # nothing else needed

beta = stats.beta(a=3, b=4)
weibull = stats.weibull_min(c=5)
scales = [
    {"scale": {"value": "linear"}, "label": "Linear (built-in)"},
    {"scale": {"value": "log", "base": 10}, "label": "Log. Base 10 (built-in)"},
    {"scale": {"value": "log", "base": 2}, "label": "Log. Base 2 (built-in)"},
    {"scale": {"value": "logit"}, "label": "Logit (built-in)"},
    {"scale": {"value": "prob"}, "label": "Standard Normal Probability (this package)"},
    {
        "scale": {"value": "prob", "dist": weibull},
        "label": "Weibull probability scale, c=5 (this package)",
    },
    {
        "scale": {"value": "prob", "dist": beta},
        "label": "Beta probability scale, α=3 & β=4 (this package)",
    },
]

N = len(scales)
fig, axes = pyplot.subplots(nrows=N, figsize=(9, N - 1), constrained_layout=True)
for scale, ax in zip(scales, axes.flat):
    ax.set_xscale(**scale["scale"])
    ax.text(0.0, 0.1, scale["label"] + " →", transform=ax.transAxes)
    ax.set_xlim(left=0.5, right=99.5)
    ax.set_yticks([])
    ax.spines.left.set_visible(False)
    ax.spines.right.set_visible(False)
    ax.spines.top.set_visible(False)

outpath = Path(__file__).parent.joinpath("../img/example.png").resolve()
fig.savefig(outpath, dpi=300)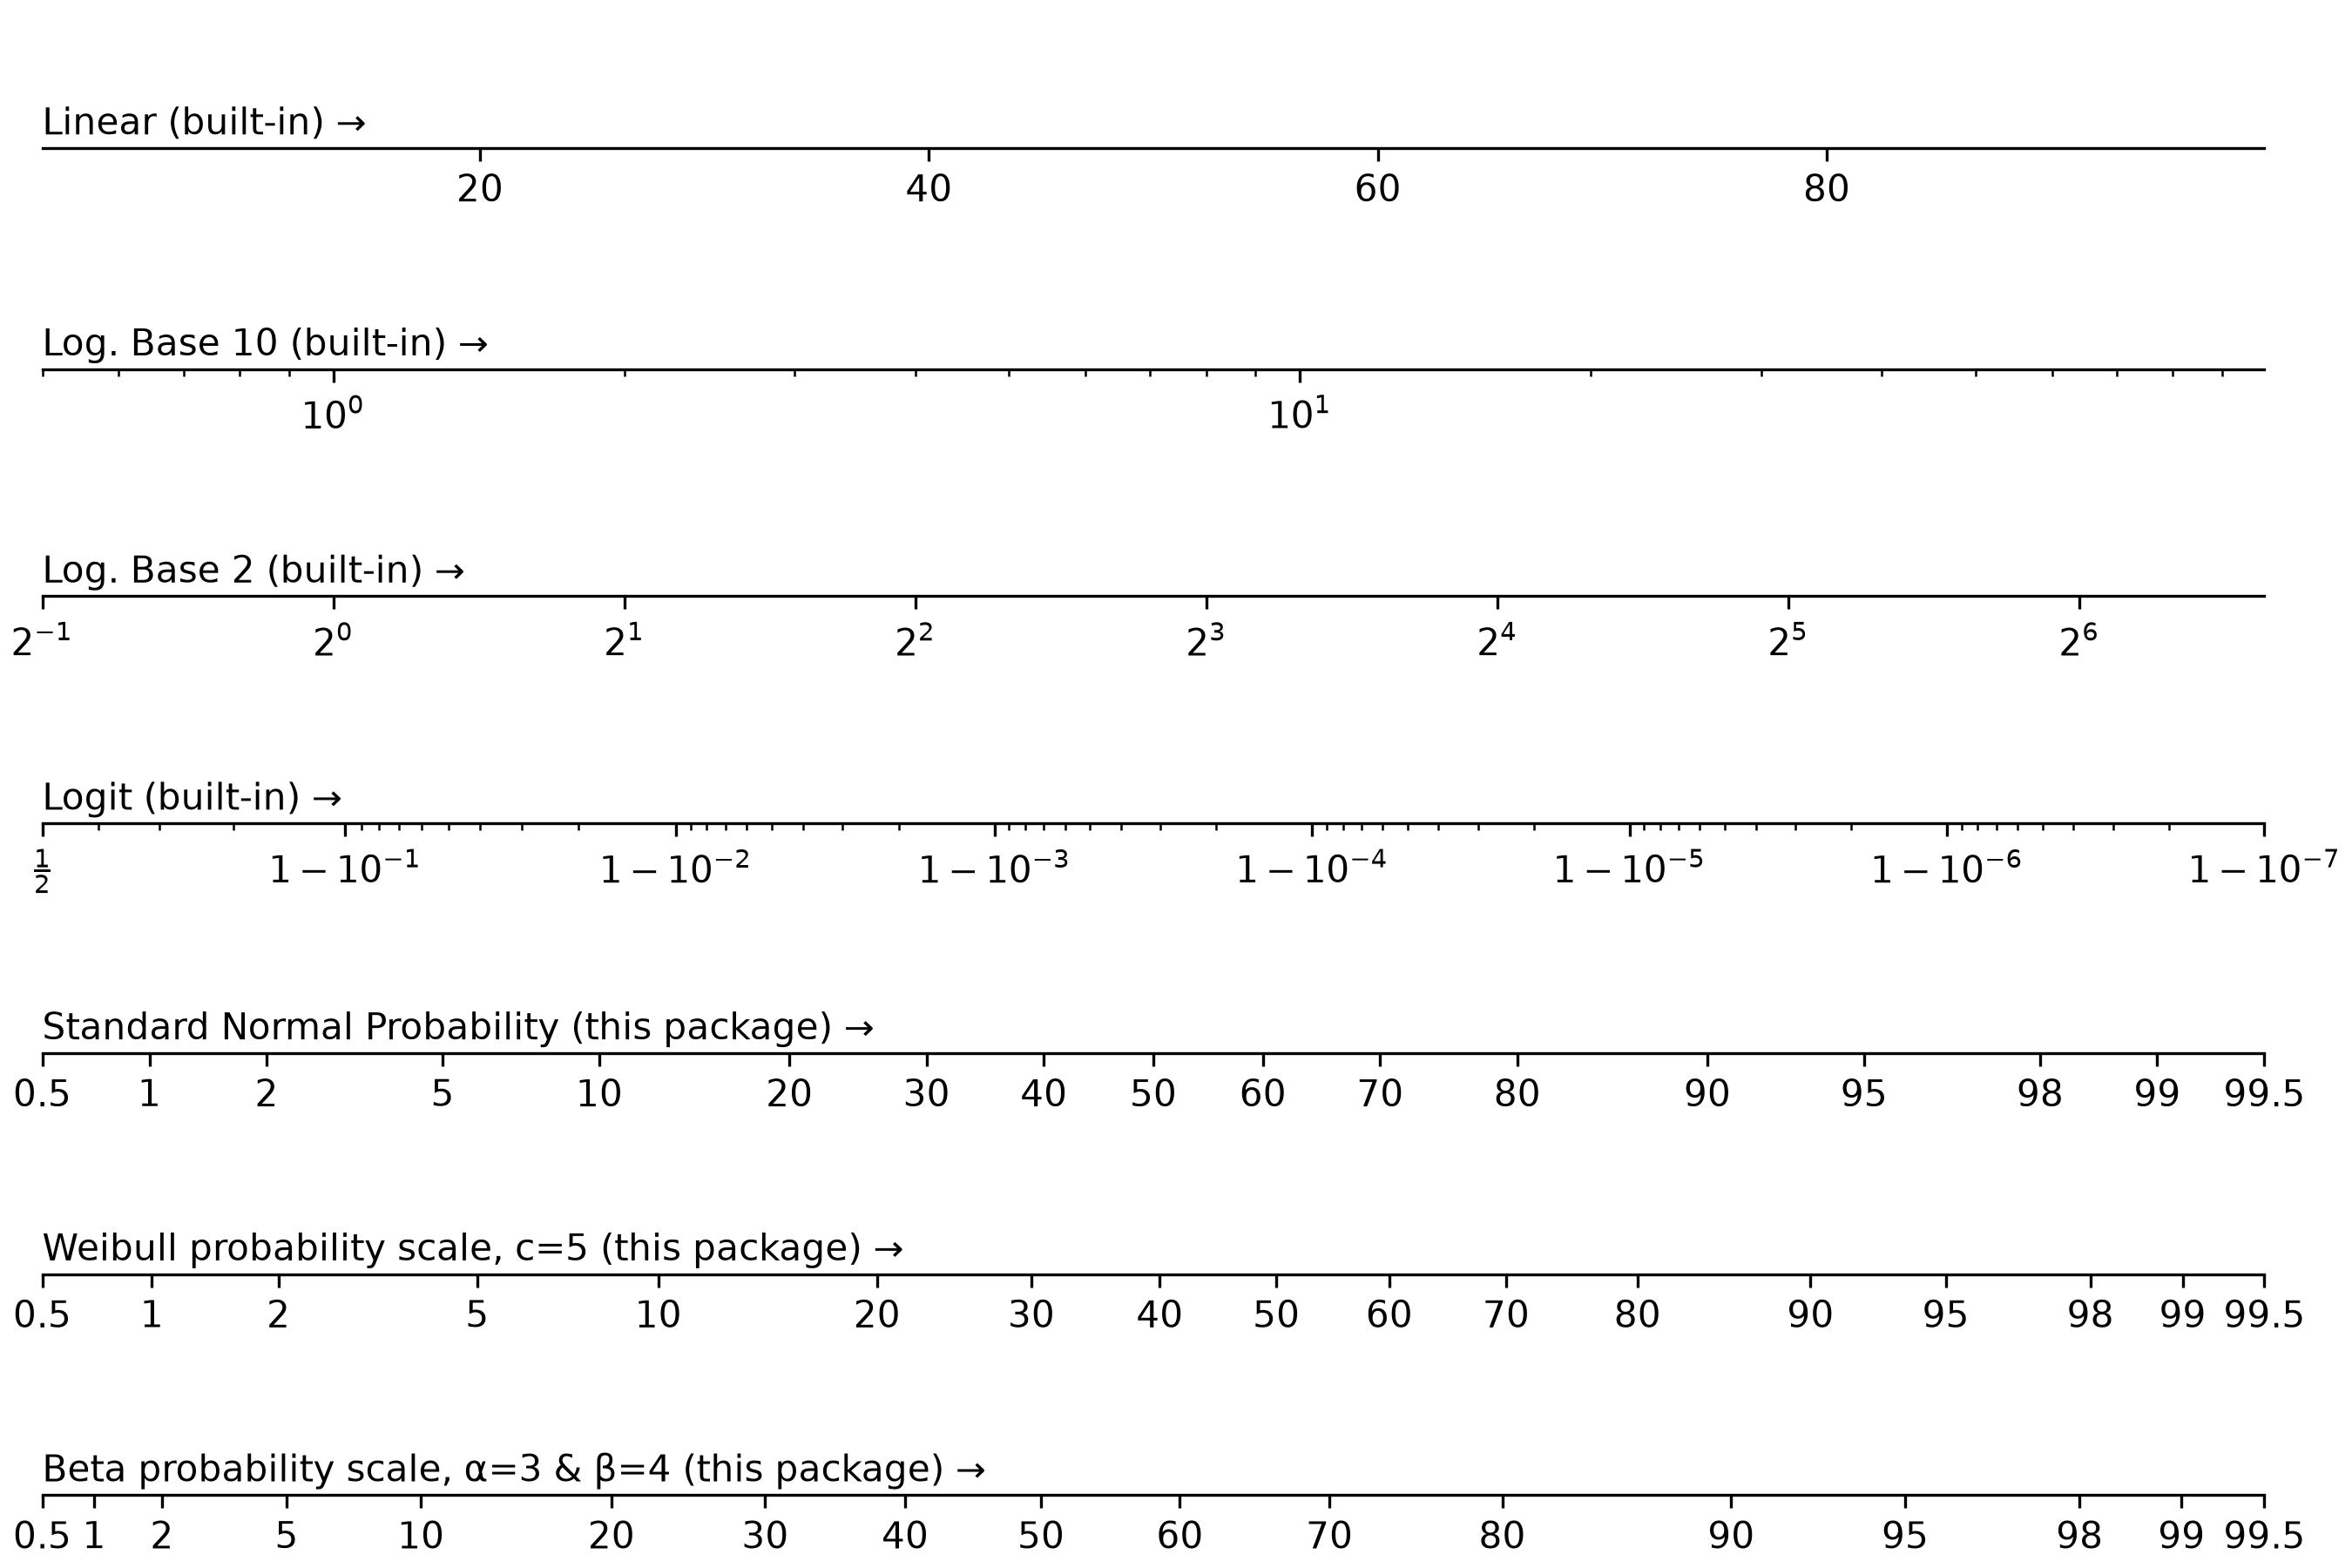
Testing is generally done via pytest.
python -m pytest --mpl --doctest-glob="probscale/*.py"Run the image comparison tests with:
uv run pytest --mpl --mpl-generate-summary=html --mpl-results-path=figcompThat will generate a figcomp folder with the results and an HTML file you can open up to view all of the failures.
If the failures are all reasonable, general new baseline images for those tests with:
uv run pytest --mpl-generate-path=baseline...and copy everything over to the right directory.