
PingDD is a cross-platform network reachability and diagnostics tool written in C that measures TCP/UDP/ICMP reachability. Where classic ping only answers "is the host up over ICMP," PingDD checks whether the service port is actually open over TCP, UDP, or ICMP, measures handshake latency to microsecond precision, and falls through IPv4/IPv6 addresses automatically. It probes many hosts, ports, protocols at once (sequentially or concurrently), reports min/max/avg, stddev and p50/p95/p99 percentiles, and runs live network-quality diagnostics: downtime, packet loss, jitter, latency spikes, bufferbloat, DNS timing distilled to a one-word HEALTHY/DEGRADED/DOWN verdict. Operator modes add continuous availability monitoring, load testing, and a resilience sweep. It also probes HTTP(S) endpoints (status code, latency, and TLS details over a bundled TLS stack), traces the network path hop by hop, and annotates addresses with reverse DNS and origin ASN. Output is human-colored, NDJSON, CSV, or Prometheus/OpenMetrics for keeping evidence across runs and feeding dashboards. Persistent options live in a small ~/.pingdd config file.
It began as a TCP "ping," which is where the name comes from. It now does considerably more than ping.
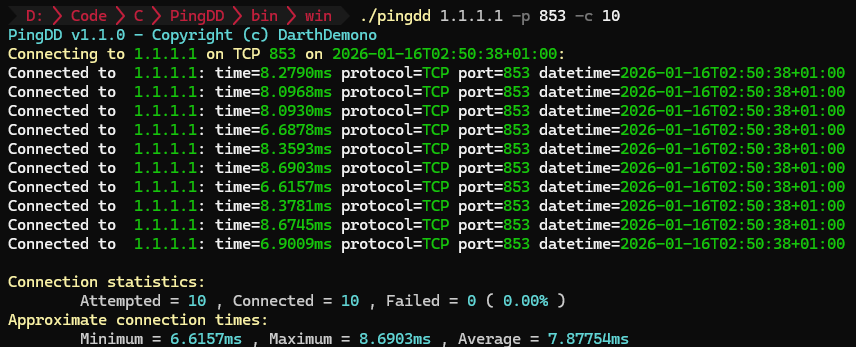
Classic ping answers exactly one question: can I reach this host over ICMP? In real troubleshooting, that is almost never the question you actually have. The real questions are:
- Is the service port open at all: 80, 443, 22, 3389, whatever you care about?
- Is the path slow because of latency, filtering, or a sluggish handshake?
- Is the quality bad: jitter, loss, spikes, bufferbloat, slow DNS?
- Was the service down ten minutes ago, and can I prove it afterward?
ICMP answers none of those. A host can happily reply to pings while the service behind it is dead, and plenty of hosts drop ICMP entirely while serving traffic just fine. So PingDD checks the thing you actually care about: the port. It measures how long the connection takes, scores the quality of the path, watches over time, and keeps the evidence in JSON or CSV so you can prove what happened after the fact.
- TCP and UDP port checks (connect-based for TCP, datagram-based for UDP).
- ICMP echo mode (classic ping) over IPv4 and IPv6.
- HTTP(S) application probe: real request, parsed status code, connect/total latency, and (for
https://) the negotiated TLS version and cipher, over a bundled mbedTLS — no system OpenSSL required. - Traceroute: TTL-stepped path discovery over IPv4 and IPv6, with optional reverse-DNS of each hop.
- Reverse DNS + origin ASN annotation of resolved addresses (via the Team Cymru IP-to-ASN service).
- IP ToS/DSCP marking on probes, and reply TTL reporting where the OS exposes it.
- Connect time (RTT) in milliseconds, measured with microsecond precision.
- IPv4 and IPv6, resolved automatically from A and AAAA records. If the first address is unreachable, it falls through to the next.
- Multi-target probing: many hosts × ports (lists and ranges) × protocols, run sequentially or concurrently.
- Source-interface selection: bind probes to a specific NIC or IP, so you can compare wifi against ethernet against a VPN on the same target.
- Summary statistics: min/max/average, standard deviation, and p50/p95/p99 percentiles.
- Network-quality diagnostics: downtime detection, packet loss, jitter, latency spikes, a bufferbloat estimate, DNS timing, and a one-word verdict of
HEALTHY,DEGRADED, orDOWN. - Three operator modes: availability monitoring, load testing, and a resilience sweep.
- Machine-readable JSON output to the terminal (
--json), or logged to an auto-named file (--json-file) or CSV (--csv) for long runs, plus a Prometheus/OpenMetrics report (--prometheus) for scraping. - A
~/.pingddconfig file (or--config FILE) for persistent defaults. - Colored output that turns itself off when piped, and honors
NO_COLOR.
Install with Winget. It drops PingDD on your PATH automatically.
winget install -e --id DarthDemono.PingDDGrab the latest pingdd-<version>-windows-x86.zip (or -arm64) from the Releases page and unzip pingdd.exe.
Grab the latest binary from the Releases page:
https://github.com/darthdemono/PingDD/releases
If your distro is not in the release list, build it yourself. The only hard dependency is a C compiler and make. HTTPS support is provided by a vendored mbedTLS git submodule, so clone with --recursive (or initialise the submodule afterward).
git clone --recursive https://github.com/darthdemono/PingDD.git
cd PingDD
make clean
make
If you already cloned without --recursive, pull the submodule in first:
git submodule update --init --recursiveThen put the binary on your PATH:
pingdd <host> [host ...] -p <port[,list,a-b]> [options]| Option | Description | Required | Default |
|---|---|---|---|
<host> ... |
One or more target hostnames/IPs (IPv4 or IPv6) | Yes* | - |
-p, --port P |
Port, comma list, or range (e.g. 80,443,8000-8010) |
TCP/UDP | - |
-P, --protocol P |
Protocol list: TCP, UDP, ICMP (comma-separated) |
No | TCP |
-I, --interface X |
Bind probes to a source IP or interface name | No | default route |
--target SPEC |
Add a host:port/proto target (repeatable) |
No | - |
--targets FILE |
Read targets from a file, one per line | No | - |
--concurrent |
Probe every target in parallel each cycle | No | sequential |
--resolve |
Annotate addresses with reverse DNS and origin ASN | No | off |
--tos N |
Set the IP ToS byte on probes (0–255) |
No | OS default |
--dscp N |
Set the DSCP class on probes (0–63) |
No | OS default |
-t, --timeout N |
Per-probe timeout in milliseconds | No | 1000 |
-c, --count N |
Number of checks | No | infinite |
-r, --rate N |
Delay between checks, in milliseconds | No | 50 |
-w, --deadline N |
Stop after N milliseconds total | No | none |
-q, --quiet |
Suppress per-probe lines, print the summary only | No | off |
-a, --audible |
Ring the terminal bell on each success | No | off |
--json |
Emit machine-readable JSON (implies no color) | No | off |
--json-file |
Log NDJSON to an auto-named .json file |
No | off |
--csv |
Log every attempt to a CSV file | No | off |
--prometheus |
Print a Prometheus/OpenMetrics report at the end | No | off |
--config FILE |
Load options from a config file | No | ~/.pingdd |
--no-config |
Ignore the implicit ~/.pingdd config file |
No | off |
--color |
Force colored output | No | auto (TTY) |
--no-color |
Disable colored output | No | auto (TTY) |
-V, --version |
Print the version | No | - |
-?, --help |
Print help | No | - |
HTTP(S) and traceroute are separate modes with their own options:
| Option | Description | Mode | Default |
|---|---|---|---|
--http URL |
Probe an http:///https:// URL |
HTTP | - |
--http-method M |
HTTP method for --http |
HTTP | GET |
--http-status N |
Require this exact status code (else any 2xx/3xx) | HTTP | any 2xx/3xx |
--traceroute |
Trace the network path to a single target | Traceroute | - |
--max-hops N |
Maximum hops to probe | Traceroute | 30 |
--queries N |
Probes sent per hop | Traceroute | 3 |
* You need a destination, but it does not have to be a positional host. --target or --targets works too. Give it several hosts, a port list or range, and a protocol list, and PingDD expands the combination into a full host × port × protocol matrix. ICMP targets ignore the port. Every target keeps its own statistics and diagnostics, and you get a combined roll-up at the end.
Color is automatic: on when output is a terminal, off when it is piped or when the NO_COLOR environment variable is set.
ICMP mode uses no port, so -p is optional there. ICMP may need elevated privileges (CAP_NET_RAW) on systems that do not allow unprivileged ICMP datagram sockets.
PingDD does not just count drops; it tries to tell you whether a drop means anything.
A single failed probe surrounded by successes is noise. A network has bad seconds. So PingDD only calls a target DOWN after several consecutive failures, and it tracks how long the outage lasted and how many times it happened. One lost packet is not an outage. Three in a row is.
The summary grades the link from loss, jitter, and latency, estimates bufferbloat from how far the slow probes drift above the baseline, and times the DNS lookup separately so a slow resolver does not get blamed on the network. The result is a one-word verdict, HEALTHY, DEGRADED, or DOWN, plus the numbers behind it. With --monitor it also prints an availability percentage.
PingDD has three modes aimed at operators rather than one-off checks.
| Mode | Flag | What it does |
|---|---|---|
| Availability | --monitor |
Probes continuously, raises outage and recovery alerts, reports uptime. |
| Load test | --load-test |
Opens sustained concurrent connections to measure behavior under load. |
| Resilience | --resilience |
Ramps concurrency in steps and reports where the service starts to degrade. |
Load-test and resilience take --concurrency N (1–256) and --duration N (seconds, 1–3600).
A word on what PingDD is not. It is not a DoS tool, and it will not become one. There is no packet flooding, no amplification, no reflection, no spoofing, and no filter bypass. None of it, by design. Load testing exists to measure your own service under pressure, nothing else. Concurrency is capped at 256 and duration at one hour. Use it on systems you own or have written permission to test. The rest is on you.
# Watch a service and report availability:
pingdd 192.168.1.10 -p 443 --monitor

# Load test your own service (loopback or private), 50 connections for 30s:
pingdd 127.0.0.1 -p 8080 --load-test --concurrency 50 --duration 30

# Find the concurrency at which your service starts to degrade:
pingdd 10.0.0.5 -p 80 --resilience --concurrency 128 --duration 60Check port 80 a hundred times:
pingdd example.com -p 80 -c 100Slow it down to one check every 500 milliseconds:
pingdd example.com -p 443 -r 500Log every attempt to CSV:
pingdd example.com -p 443 --csvProbe two hosts across a port range and two protocols at once:
pingdd 1.1.1.1 8.8.8.8 -p 53,443,8000-8005 -P TCP,UDPCompare the same target over wifi and ethernet by binding the source interface:
pingdd 1.1.1.1 -p 443 -I wlan0
pingdd 1.1.1.1 -p 443 -I eth0
Probe explicit targets in parallel, or read them from a file:
pingdd --target 1.1.1.1:443/tcp --target 8.8.8.8:53/udp --concurrent
pingdd --targets hosts.txt --monitorA TCP connect tells you a port is open; it does not tell you the service behind it is healthy. --http goes one layer up: it sends a real HTTP request and parses the status line, so you learn whether the service actually answers.
# Plain HTTP, once:
pingdd --http http://example.com/health -c 1

# HTTPS, repeated, asserting a specific status code:
pingdd --http https://example.com/ --http-status 200 -c 10

# HEAD request as JSON:
pingdd --http https://example.com/ --http-method HEAD --json -c 1
For https:// URLs PingDD performs the TLS handshake with a bundled mbedTLS and reports the negotiated protocol version and cipher suite alongside the status and timing. The connection is treated as a reachability/diagnostic probe: the certificate chain is not verified, so do not rely on --http as a security check. A probe counts as a success when the status matches --http-status, or, if that is not set, when it is any 2xx/3xx.
--traceroute discovers the path to a single target by sending probes with an increasing TTL/hop-limit and recording the router that returns each "time exceeded" message. It works over IPv4 and IPv6 and defaults to ICMP, so no port is required.
pingdd --traceroute 1.1.1.1
pingdd --traceroute --resolve --max-hops 20 --queries 2 example.com
On POSIX this needs a raw socket, so run it as root or grant CAP_NET_RAW to the binary. On Windows it uses the IP Helper API and needs no special privilege. Pass --resolve to reverse-resolve each hop to a name.
--resolve enriches each resolved address with its reverse-DNS (PTR) name and its origin Autonomous System, looked up through the Team Cymru IP-to-ASN service. It needs outbound DNS and is therefore opt-in.
pingdd --resolve -P ICMP -c 1 1.1.1.1
#   1.1.1.1 -> one.one.one.one [AS13335 CLOUDFLARENET - Cloudflare, Inc., US]
The same data appears as rdns, asn, and asn_org fields in the JSON target line.
Persistent defaults can live in ~/.pingdd, or any file passed with --config FILE. It is a simple key = value list; lines beginning with # or ; are comments. Precedence is built-in defaults < config file < command-line flags, so a flag always wins over the file. Pass --no-config to ignore the implicit ~/.pingdd.
# ~/.pingdd
timeout  = 500
protocol = TCP
resolve  = true
color    = true
Recognised keys mirror the long options: port, protocol, interface, timeout, count, rate, deadline, color, quiet, audible, json, csv, concurrent, resolve, and tos. An unknown key is an error, so typos are not silently ignored.
With --csv, PingDD writes a timestamped file and records one row per successful probe:
- DateTime
- Host
- IPAddress
- Protocol
- Port
- Time_ms
IPAddress is the address actually probed, not just the first one resolved, so when fail-over picks a different address the log shows the truth. Feed the file to whatever you graph with, compare it against another network, or keep it as a record for the next time someone insists the service "was never down."
By default the output is colored and human-readable. Two alternatives exist for everything else:
--csvkeeps a row per success, as above.--jsonprints one JSON object per probe plus a summary and a diagnostics object, with color disabled. It is line-delimited, so you can pipe it straight intojqor anything that reads NDJSON.--json-filelogs the same NDJSON to an auto-named file.--prometheusprints a Prometheus/OpenMetrics exposition at the end of the run (pingdd_up,pingdd_probes_total,pingdd_failures_total,pingdd_loss_ratio, andpingdd_rtt_seconds), one series per target withtarget/host/ip/proto/portlabels. Point it at a file for the node_exporter textfile collector, or scrape it via Pushgateway.
The makefile targets Windows (x86 and ARM64) and Linux (x86_64, ARM, ARM64).
make                # auto-detect the host
make win32          # Windows x86      -> bin/win-x86/pingdd.exe
make winarm64       # Windows ARM64    -> bin/win-arm64/pingdd.exe
make linux          # Linux native     -> bin/linux/pingdd
make linuxarm       # Linux ARM 32-bit -> bin/linux-arm/pingdd
make linuxarm64     # Linux ARM64      -> bin/linux-arm64/pingdd
Cross-compiling needs the matching toolchain (i686-w64-mingw32-gcc for Windows, aarch64-linux-gnu-gcc for Linux ARM64, and so on). The Windows targets also need a resource compiler; the makefile finds windres on its own, whether it is the plain windres from MSYS2 or the cross-prefixed one from a Linux mingw package. Every target builds the vendored mbedTLS submodule in, so make sure it is checked out (git submodule update --init --recursive).
The makefile carries a set of quality targets in addition to the build:
make test       # build, run the functional harness + unit tests
make unit       # standalone unit tests only
make asan       # AddressSanitizer + UBSan build
make coverage   # gcov coverage build + report
make analyze    # cppcheck static analysis (if installed)
make fuzz       # libFuzzer run over the URL parser (needs clang)
CI runs these on every change to src/, tests/, the makefile, or the mbedTLS submodule.
PingDD keeps the code straightforward and readable. It prefers predictable behavior, clean output, and portability over clever tricks. Changes that improve reliability and cross-platform correctness win over changes that just look smart.
"An idiot admires complexity, a genius admires simplicity" — Terry A. Davis
Contributions are welcome.
- Open an issue for bugs, feature requests, or suggestions.
- Send a pull request if you want to improve the code, the portability, the documentation, or the CI packaging.
MIT License. See LICENSE.